|
|
| |
|
|
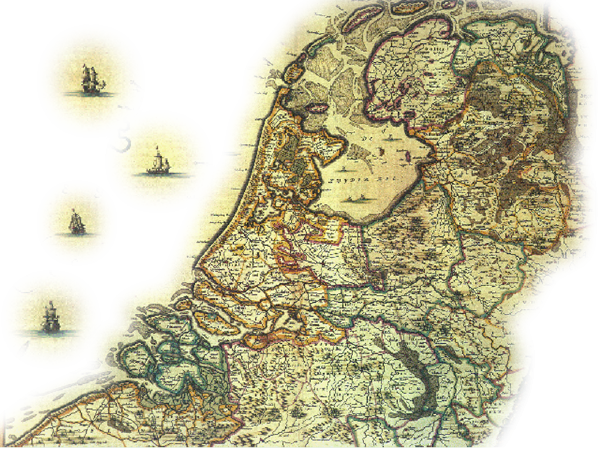 A map is nothing more than a scale-drawn representation of reality. For maps (land), this usually means that the road is shown on the charts
while maps used for navigation on water display depth and currents.
In earlier times, maps where produced by means of a fixed reference point,
distances and angles to the reference point were used to measure what they wanted to draw up.
Today they use aerial photos wich get scaled to a map. The top of a map usually represents the North.
A map is nothing more than a scale-drawn representation of reality. For maps (land), this usually means that the road is shown on the charts
while maps used for navigation on water display depth and currents.
In earlier times, maps where produced by means of a fixed reference point,
distances and angles to the reference point were used to measure what they wanted to draw up.
Today they use aerial photos wich get scaled to a map. The top of a map usually represents the North. |
| |
|
Scale
|
 When everything is represented in actual size is called a scale of 1 to 1, written down as 1:1.
This would not be useful for a map, Charts would become as huge as the representation. For this reason we draw maps smaller.
A commonly used scale: 1 to 25 000, written down on the map as 1: 25 000.
It means that 1cm on the map equals 25 000cm (250mtr).
The larger the scaling to reality becomes, the fewer details will be listed on the card.
As so the Scale 1: 250 000 will be used especially on car cards, wich are used to display the roads of a country.
When everything is represented in actual size is called a scale of 1 to 1, written down as 1:1.
This would not be useful for a map, Charts would become as huge as the representation. For this reason we draw maps smaller.
A commonly used scale: 1 to 25 000, written down on the map as 1: 25 000.
It means that 1cm on the map equals 25 000cm (250mtr).
The larger the scaling to reality becomes, the fewer details will be listed on the card.
As so the Scale 1: 250 000 will be used especially on car cards, wich are used to display the roads of a country. |
| |
|
Legend
|
 The legend is an explanation of what the symbols on the card listed mean. Colors can be used to indicate plants, dune or heath.
Lines of different thicknesses represent roads and paths. But there are also symbols for lighthouses, bridges and airports.
Normally you will find the legend on the right bottom side in a map.
The legend is an explanation of what the symbols on the card listed mean. Colors can be used to indicate plants, dune or heath.
Lines of different thicknesses represent roads and paths. But there are also symbols for lighthouses, bridges and airports.
Normally you will find the legend on the right bottom side in a map. |
| |
|
Alivation lines
|
 Since maps are drawn in flat surface altitude is not just traceable. To solve this problem so-called alivation-lines are drawn in the map.
By providing these lines with a number alivation can be read off a map.
In the picture you can see elivation-lines get established.
Top, shows contour lines as they may occur in a map. Figures 5 through 25 each show a jump of 5 meters. We call this the height figure.
This is how we can literally interpreted the top display. Of course landscapes do not change radically every 5 meters, landscapes normally have a smooth flow.
We see this reflected in the bottom picture.
Since maps are drawn in flat surface altitude is not just traceable. To solve this problem so-called alivation-lines are drawn in the map.
By providing these lines with a number alivation can be read off a map.
In the picture you can see elivation-lines get established.
Top, shows contour lines as they may occur in a map. Figures 5 through 25 each show a jump of 5 meters. We call this the height figure.
This is how we can literally interpreted the top display. Of course landscapes do not change radically every 5 meters, landscapes normally have a smooth flow.
We see this reflected in the bottom picture.
 When there is an obvious hole or bump in the landscape this may be represented by dashes. Right above an bump right-under a hole.
Other methods that you may encounter are: Shadows, clarifying slopes. The slope is colored gray so it looks like the sun coming from the northwest.
Height Colors, With color height is an indication on the map. On the border between colors alivation-lines are placed.
When there is an obvious hole or bump in the landscape this may be represented by dashes. Right above an bump right-under a hole.
Other methods that you may encounter are: Shadows, clarifying slopes. The slope is colored gray so it looks like the sun coming from the northwest.
Height Colors, With color height is an indication on the map. On the border between colors alivation-lines are placed. |
| |
|
Gridlines
|
| Good maps (topographical maps, mostly scale 1:25000 or schaal 1:50000) contain a square grid. We call this the grid lines.
Using the grid lines, you can determine where your exact position is on the map. To know how this works you'll need to know how grid lines are created.
Rural square grid
Maps are created by government agencies of the relevant country??. When the entire country is mapped, a grid is placed over this country.
Each box in the (square) grid represents a kilometer by a kilometer. By placing this grid on each part map of the country, an exact place in this
country can be measured out. We call this a map coordinate in the rural square grid. To avoid errors in length and width,
numbering is done in width from (East to West) and then numbered on in length (South to North).
For the Netherlands the width gous to 300 km and the length starts at 300 km. |
| |
|
Map Data
|
 By shifting tectonic plates and human impact changes in land mass and its classification.
Reference lines are often changed in the past and agreements changed. You need to remember that the date of a map is important. Maps made before 1984
have their reference on the grid other than cards made after 1984. This reference can easily shift for approximately 100 meter on a coordinate.
Which in turn is tricky when you want to pass your position to another, through the use of a coordinate.
The system that coordinate systems are currently based on, is called the WGS84 (World Geodetic System 1984).
GPS will use WGS84 as its standard, if you encounter a map with a different date (WGS72 or ED50) know that your GPS need to be changed to this data.
By shifting tectonic plates and human impact changes in land mass and its classification.
Reference lines are often changed in the past and agreements changed. You need to remember that the date of a map is important. Maps made before 1984
have their reference on the grid other than cards made after 1984. This reference can easily shift for approximately 100 meter on a coordinate.
Which in turn is tricky when you want to pass your position to another, through the use of a coordinate.
The system that coordinate systems are currently based on, is called the WGS84 (World Geodetic System 1984).
GPS will use WGS84 as its standard, if you encounter a map with a different date (WGS72 or ED50) know that your GPS need to be changed to this data. |
| |
|
Declination - Deviation
|
 Declination is nothing more than a difficult word deviation. When used for navigation it stands for the yearly variation between
magnetic and geographic north (Pole Star). Often the word refers to the deviation between magnetic North and North as displayed on the map.
Declination is only part of the variation, which is processed by the Geographical Service in the North on the map.
In practice, however, you can not work with a declination angle and you work with the map deveation and annual deviation correction.
(Source Geographical Service Netherlands)
If you would measure a direction between two points on the map with a map protractor. (Angle measured from the North on the map.)
Bring this angle to a compass, so you can turn into the terrain. Then you will, especially over long distances, need to perform a correction.
(Deviation correction)
In the legend of each map should be shown the variation. So on the map I have on hand: "February 30, 2000, Accuracy 4ş11’ West with a
correction factor of 7’ East.
Here: The magnetic North is 4 degrees 11 minutes West of the North as represented by the map. Every year, it moves 7 minutes Eastward. (Correction)
You should know that 7’ = (7’ x 1/60ş) = 0,12ş and 11’ = (11’ x 1/60ş = 0,18ş) (see geographic coordinates)
Annually 7 minutes to the East, in this context, implies that the angle in the area, must be corrected seven minutes to the East, each year of origin map.
The map is from February 2000 (chart datum, not purchase date), it is now February 2011 and thus, the measured angle on the map must be corrected
according to the following calculation. West = (-) and East = (+)
Deviation (age map x correction)
(-4,18ş + (11 x 0,12ş))= -2,9ş = a correction of 2,9ş West
Which means: The magnetic North is located (on Feb. 30. 2011), 2.9 degrees west to the North on the map.
A degree represents a deviation of about 17 meters for every kilometer. The correction is equal to 49mtr's for every Kilometer.
In the first year, these maps were printed, it was even 70 meters for every Kilometer.
Correction in practice
Declination is nothing more than a difficult word deviation. When used for navigation it stands for the yearly variation between
magnetic and geographic north (Pole Star). Often the word refers to the deviation between magnetic North and North as displayed on the map.
Declination is only part of the variation, which is processed by the Geographical Service in the North on the map.
In practice, however, you can not work with a declination angle and you work with the map deveation and annual deviation correction.
(Source Geographical Service Netherlands)
If you would measure a direction between two points on the map with a map protractor. (Angle measured from the North on the map.)
Bring this angle to a compass, so you can turn into the terrain. Then you will, especially over long distances, need to perform a correction.
(Deviation correction)
In the legend of each map should be shown the variation. So on the map I have on hand: "February 30, 2000, Accuracy 4ş11’ West with a
correction factor of 7’ East.
Here: The magnetic North is 4 degrees 11 minutes West of the North as represented by the map. Every year, it moves 7 minutes Eastward. (Correction)
You should know that 7’ = (7’ x 1/60ş) = 0,12ş and 11’ = (11’ x 1/60ş = 0,18ş) (see geographic coordinates)
Annually 7 minutes to the East, in this context, implies that the angle in the area, must be corrected seven minutes to the East, each year of origin map.
The map is from February 2000 (chart datum, not purchase date), it is now February 2011 and thus, the measured angle on the map must be corrected
according to the following calculation. West = (-) and East = (+)
Deviation (age map x correction)
(-4,18ş + (11 x 0,12ş))= -2,9ş = a correction of 2,9ş West
Which means: The magnetic North is located (on Feb. 30. 2011), 2.9 degrees west to the North on the map.
A degree represents a deviation of about 17 meters for every kilometer. The correction is equal to 49mtr's for every Kilometer.
In the first year, these maps were printed, it was even 70 meters for every Kilometer.
Correction in practice
 KN North on Map
MN Magnetic North
DR Target Direction
Both examples assume that the above mentioned map and is February 2011.
Example 01:
You measure an angle (300ş E), on the map (gray in the drawing).
For bringing this value to compass it is necessary to correct to the West, which gives 302,9ş East. (from map to compass, green in the drawing)
when the direction would have been taken with a compass, recorded 300 degrees (compass shoot, green in the drawing), you would have had to correct to
the east. On the map it would have been 297,1ş E..
Example 02 Calculation:
You measure an angle (70ş O.O.), on the map.
Correcting 2,9ş West, gives 72,9ş E (From map to compass)
when the direction would have been taken with a compass, recorded 70ş, you would have had to correct to
the east. On the map it would have been 67,1ş E.
How important?
For large distances, 1 km or more, the deviation can really add up. In our example (correction 2,9ş) for a distance of 2 km would have been 98mtr.
KN North on Map
MN Magnetic North
DR Target Direction
Both examples assume that the above mentioned map and is February 2011.
Example 01:
You measure an angle (300ş E), on the map (gray in the drawing).
For bringing this value to compass it is necessary to correct to the West, which gives 302,9ş East. (from map to compass, green in the drawing)
when the direction would have been taken with a compass, recorded 300 degrees (compass shoot, green in the drawing), you would have had to correct to
the east. On the map it would have been 297,1ş E..
Example 02 Calculation:
You measure an angle (70ş O.O.), on the map.
Correcting 2,9ş West, gives 72,9ş E (From map to compass)
when the direction would have been taken with a compass, recorded 70ş, you would have had to correct to
the east. On the map it would have been 67,1ş E.
How important?
For large distances, 1 km or more, the deviation can really add up. In our example (correction 2,9ş) for a distance of 2 km would have been 98mtr. |
| |
|
Map Protractor
|
A map protractor is a tool for measuring distances on a map to determine a more accurate map coordinate.
 In the upper right corner we see two rows of numbers. The numbers run from right to left from 10 to 100 which represents 0.1 to 1 km.
This also goes for the leg that points downward. The illustrated Map protractor is to be used for two maps 1:25000 and 1:50000.
Respectively, the corresponding gridlines shown in boxes of 4 and 2 cm.
The scale is listed on the map, but can easily be checked by the gridlines with the Map protractor.
In the upper right corner we see two rows of numbers. The numbers run from right to left from 10 to 100 which represents 0.1 to 1 km.
This also goes for the leg that points downward. The illustrated Map protractor is to be used for two maps 1:25000 and 1:50000.
Respectively, the corresponding gridlines shown in boxes of 4 and 2 cm.
The scale is listed on the map, but can easily be checked by the gridlines with the Map protractor. |
| |
|
Map Coordinate (square grid)
|
| As mentioned earlier, you can use a map coordinate to locate an exact position on a topographic map indicated in distances to a reference.
Horizontally a vertically grid lines are drawn on the map with at the ends a number. The number is the distance in kilometers to the reference.
For a map coordinate (MC) in a squire grid (RD "National Triangulation, for the Netherlands') we note the horizontal (west to east) first, followed
by vertical distance (South to North).
example:
MC 153,90 – 371,25 this is a point located 153.9 km East and 71.25 km North of a national reference.
RD 153,90 – 371,25 this is a point located 153.9 km East and 71.25 km north of the Dutch reference.
To know understand the 3 you will need to read "Grid Lines". |
| |
|
Measuring a map coordinate
|
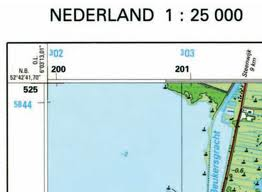
| Put the card protractor with the zero at the point of wich you want to determine the coordinate. |
|
|
|
Make sure you keep the legs of the protractor parallel to the gridlines.
Read the kilometer distance from the map:
002 km in width and 303 height.
Read the protractor: 800 meters in width and 200 meters in height.
The map coordinate becomes: RD 002,80 – 303,20 (Dutch grid) of MC 002,80 - 303,20.
Not in every country uses a squire grid, there can be chosen to use UTM or geographic system. These coordinates are recorded differently. |
| |
|
UTM - Coordinates
|
A UTM coordinate is nothing more than a squire grid applied on a global scale. UTM, which stands for Universal Transverse Mercator,
shows how the map is created.
Zones
From the Greenwich meridian, the equator is divided into 60 equal pieces. 30 pieces of 6 degrees west and 30 pieces of 6 degrees to the east.
Simple calculation 60 x 6ş = 360ş, a circle. The zones each have a unique number starting with 1 for the zone (180ş - 174ş West) and ends with
60 for the zone (174ş - 180ş Oost). The start and end of each zone are imaginary lines drawn along the earth's surface to the poles.
Where they come together by the curvature of the earth. When you would cut through the earth and open the zone lines you would get triangles.
It thus appears that each zone is a point whose largest value is 1/60the part of the length of the equator.
Since the circumference of the Earth is 40,074 km, the width of a zone is up to 667.9 km. In the middle of each zone, at 3ş Thus, one takes a reference.
This reference line is called an origin line.
Bands
To gain insight into the bands, we make a distribution from the equator on the Greenwich meridian. These pieces each measuring 8 degrees and are
designated with letters. This ranges from C, for the band from 80ş to 72ş south, to W for the band of 64ş to 72ş North.
Those who count will not come true. That's right, the letters I and O have no band awarded to the avoid confusion with J and Q.
Additionally we have the band X wich runs from 72ş to 84ş. The band X is made 4ş higher so the entire land surface can be closed into bands.
Characters, the lcharacters A, B, Y and Z are used for the poles which fall outside the UTM grid.
Map making
As we know the earth is spherical. To display its surface on a flat map, we use a Mercator projection. In a Mercator projection an imaginairy cylinder
is placed around the earth while the surface of the earth is projected on the inside of the cylinder. When the cylinder is cut it creates a flat map.
By the spherical surface of the earth, towards the poles you get an increasing bias. This bias is made smaller by turning the cylinder a quarter turn,
causing the cylinder axis to stand perpendicular to the earths axis and placing one meridian parallel to the cylinder wall.
We call this a Transverse Mercator Projection. Due to an origin meridian line to keep the maximum distortion per zone 0.1%.
Through zones and belts now basically a place in the world can be indicated. By placing a squire grid over the resulting map there can also be measured.
 In the example you see Germany (Zone 32 and 33, Band T and U). The colored line is the origin line from which the map is projected and the width
to which you refer in the measurement of a coordinate. The value 500 ensures that you always have positive measure because the maximum width of
a zone was 667.9 km. (See zones).
The square grid consisting of black lines, is the designation of the 100 km grid. When one takes a topographic map the square grid divided
into compartments of 1 kilometer which are numbered by displaying the hundreds numbers small and tens large.
550 - 5750 is the combination of lines that indicate the center of the box, the U of 32U is positioned here.
The coordinate is written as: (32U 550000 5750000)
From this example we now know it is 5750 km north of the equator and 50 km east of the origin line for sector 32 band U.
Example two: 32U 380560 5400200 UTM coordinate which stands for:
5400,2 km North of the equator and 129,44 km West of the source line of sector 32 band U.
See explanation map data, which can affect accuracy.
In the example you see Germany (Zone 32 and 33, Band T and U). The colored line is the origin line from which the map is projected and the width
to which you refer in the measurement of a coordinate. The value 500 ensures that you always have positive measure because the maximum width of
a zone was 667.9 km. (See zones).
The square grid consisting of black lines, is the designation of the 100 km grid. When one takes a topographic map the square grid divided
into compartments of 1 kilometer which are numbered by displaying the hundreds numbers small and tens large.
550 - 5750 is the combination of lines that indicate the center of the box, the U of 32U is positioned here.
The coordinate is written as: (32U 550000 5750000)
From this example we now know it is 5750 km north of the equator and 50 km east of the origin line for sector 32 band U.
Example two: 32U 380560 5400200 UTM coordinate which stands for:
5400,2 km North of the equator and 129,44 km West of the source line of sector 32 band U.
See explanation map data, which can affect accuracy. |
| |
|
MGRS (Military Grid Reference system)
|
 The MGRS is a system, which as the name would suggest, developed for the military.
It is nothing more than an extension of the UTM system.
The 100 km grid is filled with a combination of two letters. This allows the hundreds in the coordinate to expire.
Our previous examples, accurate in meters, then becomes:
The MGRS is a system, which as the name would suggest, developed for the military.
It is nothing more than an extension of the UTM system.
The 100 km grid is filled with a combination of two letters. This allows the hundreds in the coordinate to expire.
Our previous examples, accurate in meters, then becomes: |
| UTM coördinate |
MGRS coördinate |
| 32U 550000 5750000 |
32U NC 50000 50000 |
| 32U 380560 5400200 |
32U LV 80560 00200 |
|
| The table above right shows how the lettering of a 100 km grid is built. |
| |
|
Geographic coordinate system
|
In the WGS84 coordinates can also be formed. The reference lines are again the Equator and the Greenwich meridian.
The coordinate is now given in corners, which are measured over the center of the earth.
 The sketch shows how the measured angles are created.
Width is the angle between the equator and the parallel you find yourself.
Length is the angle between the meridian and prime meridian which is yourself.
In practice it is obviously not possible to measure the angles. They can however, be read from topographic maps.
Before we do this it is easy just to look at the notations.
In base we use degrees (ş) every degree can be divided into 60 minutes(‘) every minute can be divided into 60 seconds(“)
and every second can ultimately be divided into milliseconds(’’’) in practice never to be used.
In base as a geographical coordinate can be recorded in three ways.
When we take a topographic map in the corners the exact coordinate of the image can be found. This is listed as follows:
51ş15’09,70” N.W. (Northern Width) and 5ş18’57,64” E.L. (Easter length)
Combined with the picture above it says:
The wide angle between your position and the equator is 51 degrees, 15 minutes and 9,7 seconds in the Northern Hemisphere.
The length angle between your position and the prime meridian, is 5 degrees, 18 minutes and 57,64 seconds to the East.
If we write this down as a coordinate:
N 51ş15’09.70” , E 5ş18’57.64” (h dddş mm’ ss,ss”)**.
When the seconds get multiplied by 1/60 the minutes format is reached. Wich we write down as:
N 51ş15,160’ , E 5ş18,960’. (h dddş mm,mmm’)**.
When the minutes get multiplied with 1 / 60 the degrees format gets reached. Wich we write down as:
N 51,25272ş , E 5,32606ş (h dd,dddddş)**.
** (h = hemisphere, d = degrees, m = minutes and s = seconds).
Above are all values on wich a GPS can be set.
Map
On a map you can only read the minutes. Between the length angle 5ş20’ and 5ş21’ is a difference of 46mm, Our example N 51ş15,160’.
When we at 23mm (half) record the coordinates we get the following notation:
h dddş mm’ ss,ss” E 5ş20’30,00” 0,5 x 60
h dddş mm,mmm’ E 5ş20,500’ 0,5 minute
h dd,dddddş E 5,34166ş 20,5 : 60
Attention! Again, the map datum WGS84 is essential
Convert geographic coordinates
Angle in length 5ş20’ and 5ş21’ has a difference of 46mm, on width N 51ş15,160’.
Value A (minute East or West) example = 46 mm
Value B (minuut North or East) allways = 74 mm
A, B and all other to be taken values are to be taken in one unit, in this case mm millimeters
Value C, 1 minute for each grid square represents one minute
Value D, 60 seconds for 1 minute equals 60 seconds
Measure Map coordinate
Measured value in length 10mm, format: h dddş mm’ ss,ss”
Part D by A times measured value: (60 / 46)*10 = 30,04” (seconds)
Measured value in length 30mm, format: h dddş mm,mmm’
Part C by A times measured value: (1 / 46)*30 = 00,652’ (minutes)
Measure Map coordinate, Measured value format: h dddş mm’ ss,ss”
Length 10,00”: Part A with the result of: D parted by the obtained value.
46 / (60 / 10) = 7,66 mm on the map, changes every width-line.
Width 10,00”: Part B with the result of: D parted by the obtained value.
74 / (60 / 10) = 12,33 mm on the map, the same for every meridian.
Measure Map coordinate, Measured value format: h dddş mm,mmm’
Length 00,500’: Part A with the result of: C parted by the obtained value.
46 / (1 / 0,5) = 23 mm on the map, changes every width-line.
Width 00,500’: Part B with the result of: C parted by the obtained value.
74 / (1 / 0,5) = 37 mm on the map, the same for every meridian.
The sketch shows how the measured angles are created.
Width is the angle between the equator and the parallel you find yourself.
Length is the angle between the meridian and prime meridian which is yourself.
In practice it is obviously not possible to measure the angles. They can however, be read from topographic maps.
Before we do this it is easy just to look at the notations.
In base we use degrees (ş) every degree can be divided into 60 minutes(‘) every minute can be divided into 60 seconds(“)
and every second can ultimately be divided into milliseconds(’’’) in practice never to be used.
In base as a geographical coordinate can be recorded in three ways.
When we take a topographic map in the corners the exact coordinate of the image can be found. This is listed as follows:
51ş15’09,70” N.W. (Northern Width) and 5ş18’57,64” E.L. (Easter length)
Combined with the picture above it says:
The wide angle between your position and the equator is 51 degrees, 15 minutes and 9,7 seconds in the Northern Hemisphere.
The length angle between your position and the prime meridian, is 5 degrees, 18 minutes and 57,64 seconds to the East.
If we write this down as a coordinate:
N 51ş15’09.70” , E 5ş18’57.64” (h dddş mm’ ss,ss”)**.
When the seconds get multiplied by 1/60 the minutes format is reached. Wich we write down as:
N 51ş15,160’ , E 5ş18,960’. (h dddş mm,mmm’)**.
When the minutes get multiplied with 1 / 60 the degrees format gets reached. Wich we write down as:
N 51,25272ş , E 5,32606ş (h dd,dddddş)**.
** (h = hemisphere, d = degrees, m = minutes and s = seconds).
Above are all values on wich a GPS can be set.
Map
On a map you can only read the minutes. Between the length angle 5ş20’ and 5ş21’ is a difference of 46mm, Our example N 51ş15,160’.
When we at 23mm (half) record the coordinates we get the following notation:
h dddş mm’ ss,ss” E 5ş20’30,00” 0,5 x 60
h dddş mm,mmm’ E 5ş20,500’ 0,5 minute
h dd,dddddş E 5,34166ş 20,5 : 60
Attention! Again, the map datum WGS84 is essential
Convert geographic coordinates
Angle in length 5ş20’ and 5ş21’ has a difference of 46mm, on width N 51ş15,160’.
Value A (minute East or West) example = 46 mm
Value B (minuut North or East) allways = 74 mm
A, B and all other to be taken values are to be taken in one unit, in this case mm millimeters
Value C, 1 minute for each grid square represents one minute
Value D, 60 seconds for 1 minute equals 60 seconds
Measure Map coordinate
Measured value in length 10mm, format: h dddş mm’ ss,ss”
Part D by A times measured value: (60 / 46)*10 = 30,04” (seconds)
Measured value in length 30mm, format: h dddş mm,mmm’
Part C by A times measured value: (1 / 46)*30 = 00,652’ (minutes)
Measure Map coordinate, Measured value format: h dddş mm’ ss,ss”
Length 10,00”: Part A with the result of: D parted by the obtained value.
46 / (60 / 10) = 7,66 mm on the map, changes every width-line.
Width 10,00”: Part B with the result of: D parted by the obtained value.
74 / (60 / 10) = 12,33 mm on the map, the same for every meridian.
Measure Map coordinate, Measured value format: h dddş mm,mmm’
Length 00,500’: Part A with the result of: C parted by the obtained value.
46 / (1 / 0,5) = 23 mm on the map, changes every width-line.
Width 00,500’: Part B with the result of: C parted by the obtained value.
74 / (1 / 0,5) = 37 mm on the map, the same for every meridian. |
| |
|
GPS (Global Positioning System)
|
 Currently the easiest tool to navigate is the GPS navigation. Available from simple devices which can display a coordinate or navigation which can give
streets and house numbers. But, it dous not matter how expensive the equipment is, they all work the same.
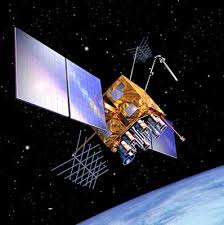
Around the earth circulate satellites wich put out a signal. A GPS grabs as much signals as possible and measures the distance to each satellite.
The software in the device calculates the position on earth and gives the position, this by coordinate or through a digital map.
The GPS systems designed to use in the field, the so called "handheld" devices, you are able to change settings.
The most important are:
Map Date: (see previous Map Data)
System: Geographical, h dddş mm’ ss,ss”, h dddş mm,mmm’ and h dd,dddddş
RD (National Triangulation) for the Dutch grid.
Other countries specific settings
Remember that GPS is only a tool, which dous not function longer then the battery inside.
Use differs with each GPS-system, see the separate manual.
Currently the easiest tool to navigate is the GPS navigation. Available from simple devices which can display a coordinate or navigation which can give
streets and house numbers. But, it dous not matter how expensive the equipment is, they all work the same.
Around the earth circulate satellites wich put out a signal. A GPS grabs as much signals as possible and measures the distance to each satellite.
The software in the device calculates the position on earth and gives the position, this by coordinate or through a digital map.
The GPS systems designed to use in the field, the so called "handheld" devices, you are able to change settings.
The most important are:
Map Date: (see previous Map Data)
System: Geographical, h dddş mm’ ss,ss”, h dddş mm,mmm’ and h dd,dddddş
RD (National Triangulation) for the Dutch grid.
Other countries specific settings
Remember that GPS is only a tool, which dous not function longer then the battery inside.
Use differs with each GPS-system, see the separate manual. |
|
|
|
|
| |